Part I: EM and Shift-Invariant Models
In this problem we will consider shift-invariant mixtures of multi-variate multinomial distributions.
Consider data that have multiple discrete attributes. "Discrete" attributes are attributes that can take only one of a countable set of values. We will consider discrete attributes of a particular kind -- integers that have not only a natural rank ordering, but also a definite notion of distance.
Let (X,Y) be the pair of discrete attributes defining any data instance. Since both X and Y are discrete, the probability distribution of (X,Y) is a bi-variate multinomial.
We describe (X,Y) as the outcome of generation by the following process:
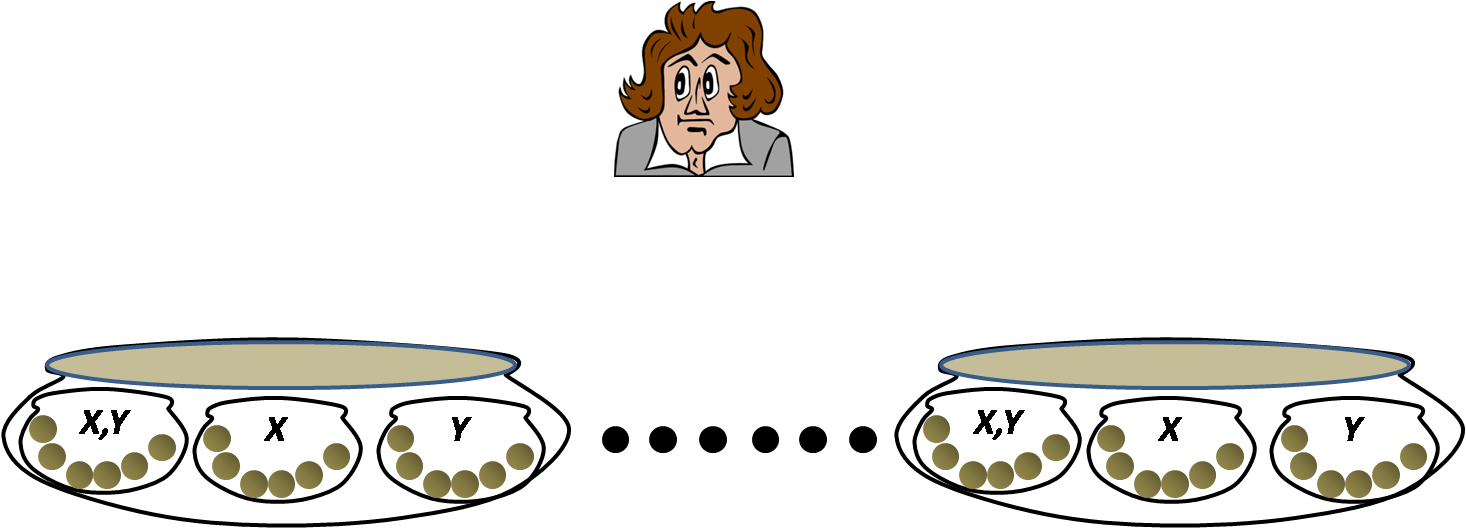
The process has at its disposal several urns. Each urn has three sub-urns inside it. The first sub-urn represents a bi-variate multinomial: it contains balls, such that each ball has an (X,Y) value marked on it. The second sub-urn represents a uni-variate multinomial -- it contains balls, such that each ball has a Y value marked on it. The third sub-urn too represents a uni-variate multinomial -- it contains balls, such that each ball has a X value marked on it.

Drawing procedure: At each draw the drawing process performs the following operations.
- It first randomly selects one of the larger urns according to a probability distribution P(Z). Here Z represents the urn selected.
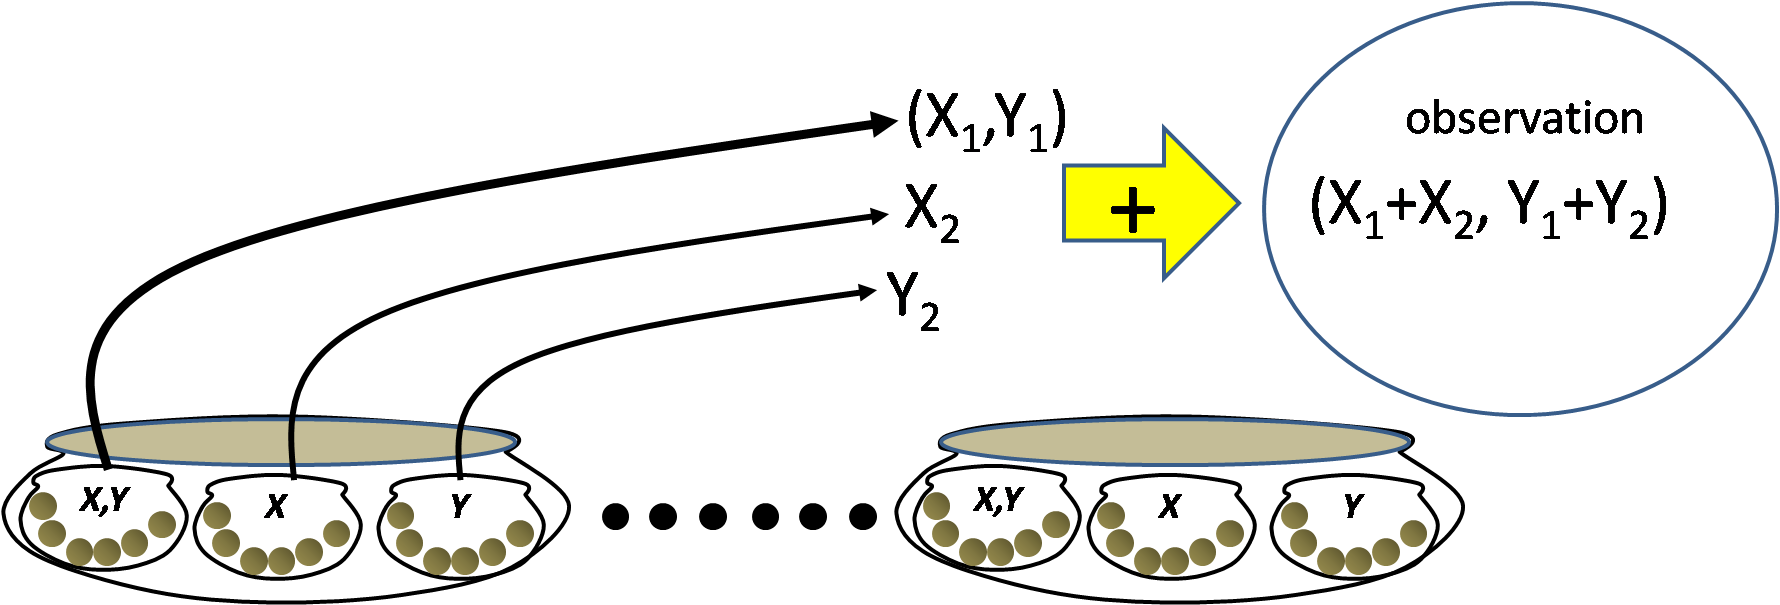
- Then it selects one ball each from each of the sub-urns in the selected urn.The probability of balls in the (X,Y) sub-urn of the Zth urn is P(X,Y|Z). The probability of balls in the (X) sub-urn of the Zth urn is P(X|Z). The probability of balls in the (Y) sub-urn of the Zth urn is P(Y|Z).
- Let (X1,Y1) be the numbers on the ball drawn from the (X,Y) sub-urn. Let X2 be the number on the ball drawn from the (X) sub-urn. Let Y2 be the number on the ball drawn from the (Y) sub-urn. The process finally outputs (X1+X2,Y1+Y2).

The final observation is:
Problem 1 (1 pt)
Give the expression for P(X,Y) in terms of P(Z), P(X,Y|Z), P(X|Z), and P(Y|Z).
Problem 2 (5 pts)
You are given a histogram of counts H(X,Y) obtained from a large number of observations. H(X,Y) represents the number of times (X,Y) was observed. Give the EM update rules to estimate P(Z), P(X,Y|Z), P(X|Z), and P(Y|Z).
Problem part 3 (3 pts)
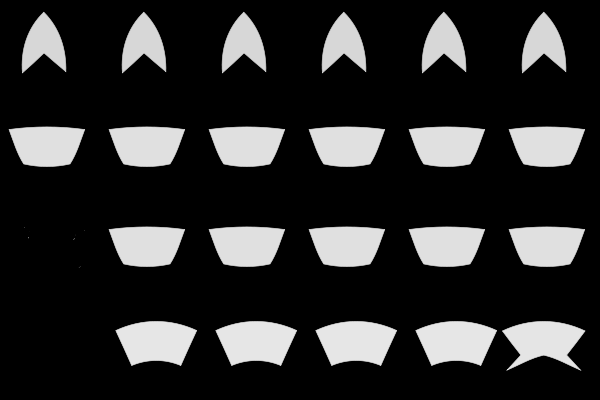
represents a histogram (the value of any pixel at a position (X,Y), which ranges from 0-255, is viewed as the count of ``light elements'' at that position). We model this distribution as a shift-invariant mixture of 4 components (large urns). Specifically, we also assume that within each (X,Y) sub-urn X can take integer values 0-90, and Y can take values in 0-90. The X values in the X sub-urns can range from 0-(width-of-picture - 90), and Y values in the Y suburn can take values in the range 0-(heigth-of-picture-90).
Estimate and plot P(X,Y|Z). You will need the solution to problem 2 for this problem. If the solution to problem 2 is incorrect, the solution of problem 3 will not be considered or given any points.
Due date
The assignment is due on 3 Dec 2013. The solutions must be emailed to Bhiksha and the TAs (Varun and/or James). Please send the solutions as a zipfile called yourandrewid_mlsp_hw3.zip. This should include:
- The solutions for parts 1 and 2 in a pdf file.
- The images representing the solution for part 3. These may be sent separately as image files, or included in your pdf report.
